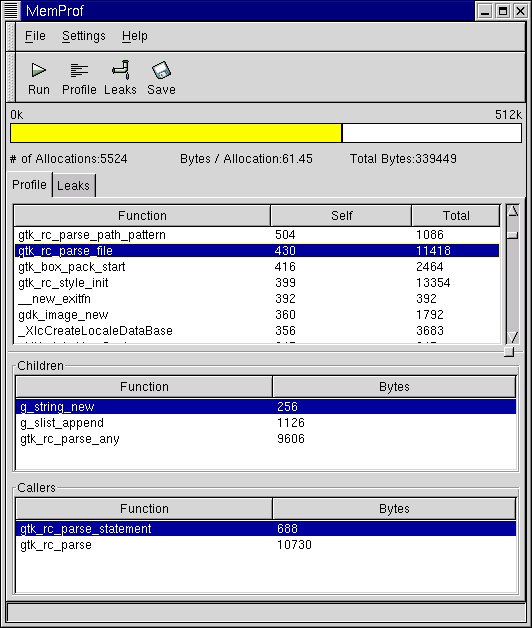
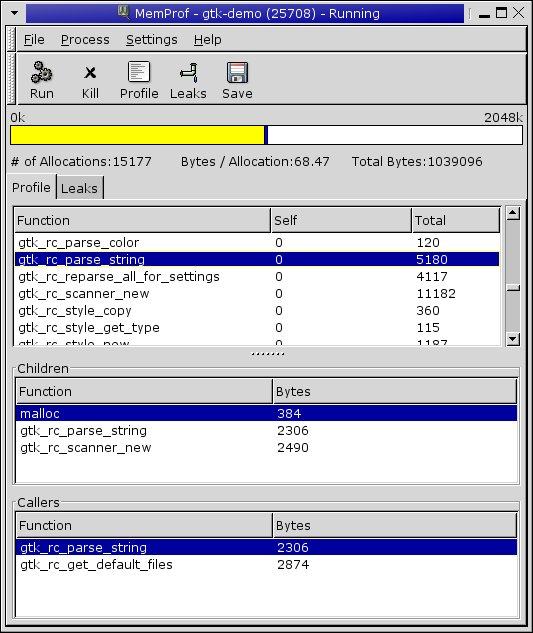
MemProf is a tool for profiling memory usage and finding memory leaks. Its two major features are:
MemProf works by pre-loading a library to override the C library's memory allocation functions and does not require you to recompile your program.
One advantage MemProf has over some other similar tools that are available is that it has a nice GUI frontend and is relatively easy to use.
For 0.6.2 various crashes in the memory profiling and leak handling were fixed and 0.6.2 should be as stable as 0.6 used to be. On top of the crash fixing changes from memprof-revised were included and the most prominet of them are the timegraph and memory map in the memory profiling view.
The project was forked as the website vanished from the GNOME project infrastructure, the current maintainer didn't respond to inquieries and memprof is far too young too let it die. The code and releases will be hosted here and hopefully one day it will be back on the GNOME infrastructure.
The main attraction of 0.6 is that memprof now works again, thanks to Michael Meeks. Other new features in the four years since 0.5.1 release include a rewritten profile module that handles recursion better. Also a large number of bugs have been fixed.
0.5.1 reworks the way that libmemintercept.so works to work a lot better with C++ and with threads. (it fixes the infamous "Starter malloc size exceeded" bug) It also changes the data structures in the main program to use considerably less memory.
The big change in this release is a port to GTK+-2.0 and GNOME-2.0, done by Kristian Rietveld. There are also quite a few bug fixes since 0.4.1.
This is mostly a bug fix release - it fixes problems with recent versions of libc, a crash when using menu accelerators, a problem with leaving sockets around, and so forth.
It also includes a bunch more translations and a feature to do regular-expression based exclusion of funtions from Martin Baulig.
The backend in 0.4.0 has been almost totally rewritten to support profiling threaded programs and to follow the children of programs that fork.
The front end has also been improved in a number of ways, translations have been added for 12 languages, and numerous bugs have been fixed by myself and others.
Numerous bugs have most likely also been added, so please try it out, find them, and let me know.
For the interface, memprof requires:
These (or newer versions) are all available from http://ftp.gnome.org/pub/GNOME/sources/ but if binary packages are available from your distribution, it's much easier to install them that way.
git clone git://gitorious.org/memprof/memprof.git
Discussion of using and developing Memprof occurs on memprof-list@gnome.org. Subscription information
Bugs should be reported to the GNOME bug tracking system. (http://bugzilla.gnome.org/, project memprof). You will need to create an account for yourself.
The technique that MemProf uses for detecting leaks, scanning memory for pointers, is the basis of the Boehm Garbage Collector. While the Boehm GC is mostly meant for memory management, it also has a mode for leak detection in programs that manually free memory. The package, unlike MemProf, is highly portable.
Keith Packard wrote a memory debugging library (memleak) included with X that does leak detection. This was separated out from the X distribution by Jon Christopher and turned into the standalone Debauch package. From the documentation Debauch seems similar to MemProf in scope and techniques but somewhat more comprehensive and portable. It doesn't, however, have MemProf's nice GUI frontend.